Modern Observability: OpenTelemetry, Grafana, and Loki
Introduction
Observability is a critical component of modern software development, enabling teams to understand how their applications behave in production. In this article, we’ll explore the intersection of OpenTelemetry, Grafana, and Loki, three powerful tools that form the foundation of modern observability.
What is Observability?
Observability is the ability to understand the internal state of a system by analyzing its outputs. It’s about being able to diagnose issues, measure performance, and optimize the system for better user experiences. In the context of software development, observability is essential for ensuring that applications are reliable, scalable, and performant.
OpenTelemetry: The Standard for Distributed Tracing
OpenTelemetry is an open-source observability framework that provides a standardized way of collecting and exporting telemetry data from applications. It’s designed to work with a wide range of programming languages and frameworks, making it a versatile choice for modern development teams.
import (

	"context"

	"fmt"

	"log"
"go.opentelemetry.io/otel"
"go.opentelemetry.io/otel/exporters/jaeger"
"go.opentelemetry.io/otel/trace"
)
func main() {
// Create a Jaeger exporter
exporter, err := jaeger.New(jaeger.WithCollectorEndpoint(jaeger.WithEndpoint("http://localhost:14268/api/traces")))
if err != nil {
log.Fatal(err)
}
// Create a tracer
tracer := otel.Tracer("my-service")
// Start a span
ctx := context.Background()
span := tracer.Start(ctx, "my-span")
defer span.End()
// Do some work
fmt.Println("Doing some work...")
Grafana: The Visualization Powerhouse
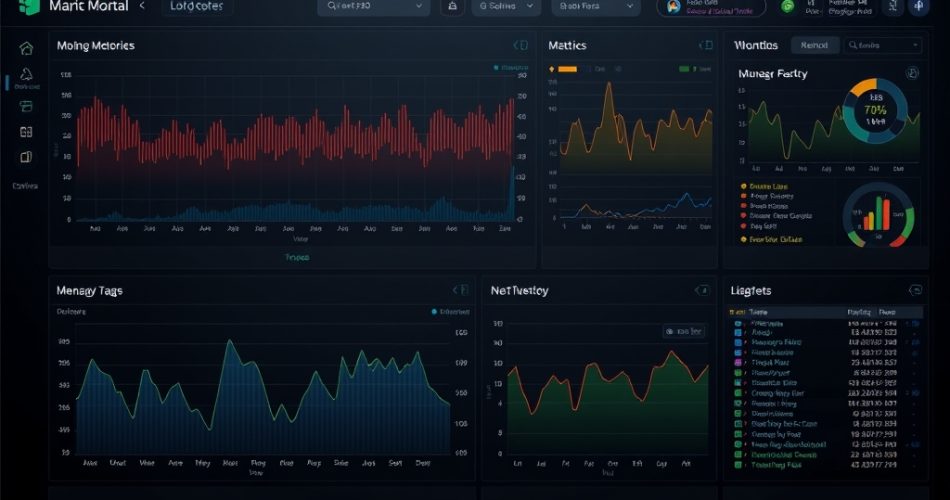
Grafana is a popular open-source platform for creating dashboards and visualizations. It’s designed to work with a wide range of data sources, including OpenTelemetry, Loki, and others. Grafana provides a flexible and customizable way of presenting data, making it an essential tool for observability.
Loki: The Log Aggregation Platform
Loki is a log aggregation platform that provides a scalable and efficient way of collecting and indexing log data. It’s designed to work with a wide range of log formats and protocols, making it a versatile choice for modern development teams.
import (

	"context"

	"fmt"

	"log"
"go.opentelemetry.io/otel"
"go.opentelemetry.io/otel/exporters/otlp/otlphttp"
"go.opentelemetry.io/otel/trace"
)
func main() {
// Create an OTLP exporter
exporter, err := otlphttp.NewExporter(otlphttp.WithEndpoint("http://localhost:4317"))
if err != nil {
log.Fatal(err)
}
// Create a tracer
tracer := otel.Tracer("my-service")
// Start a span
ctx := context.Background()
span := tracer.Start(ctx, "my-span")
defer span.End()
// Do some work
fmt.Println("Doing some work...")
Practical Tips and Real-World Insights
Here are some practical tips and real-world insights to keep in mind when implementing OpenTelemetry, Grafana, and Loki:
- Start small: Begin with a simple implementation and gradually scale up as needed.
- Choose the right data sources: Select data sources that align with your observability goals and requirements.
- Customize your dashboards: Use Grafana’s flexible and customizable dashboard features to present data in a way that makes sense for your team.
- Monitor your logs: Use Loki to collect and index log data, and Grafana to visualize it.
- Integrate with other tools: Use OpenTelemetry to integrate with other tools and platforms, such as monitoring and alerting systems.
Conclusion
OpenTelemetry, Grafana, and Loki are powerful tools that form the foundation of modern observability. By implementing these tools, development teams can gain a deeper understanding of their applications and make data-driven decisions to improve performance, reliability, and scalability. Remember to start small, choose the right data sources, customize your dashboards, monitor your logs, and integrate with other tools to get the most out of these powerful observability tools.
Key Takeaways
Here are the key takeaways from this article:
- OpenTelemetry is an open-source observability framework that provides a standardized way of collecting and exporting telemetry data.
- Grafana is a popular open-source platform for creating dashboards and visualizations.
- Loki is a log aggregation platform that provides a scalable and efficient way of collecting and indexing log data.
- These tools can be used together to form a powerful observability stack.

